Fueling a Smarter Tomorrow

A stack of disorganized papers and folders of various colors, including white, pink, purple, yellow, and green, placed on a flat surface.

Small Businesses need to move away from administrative burdens

Use smart Analysis to review your processes and see where your inefficiencies can be eliminated
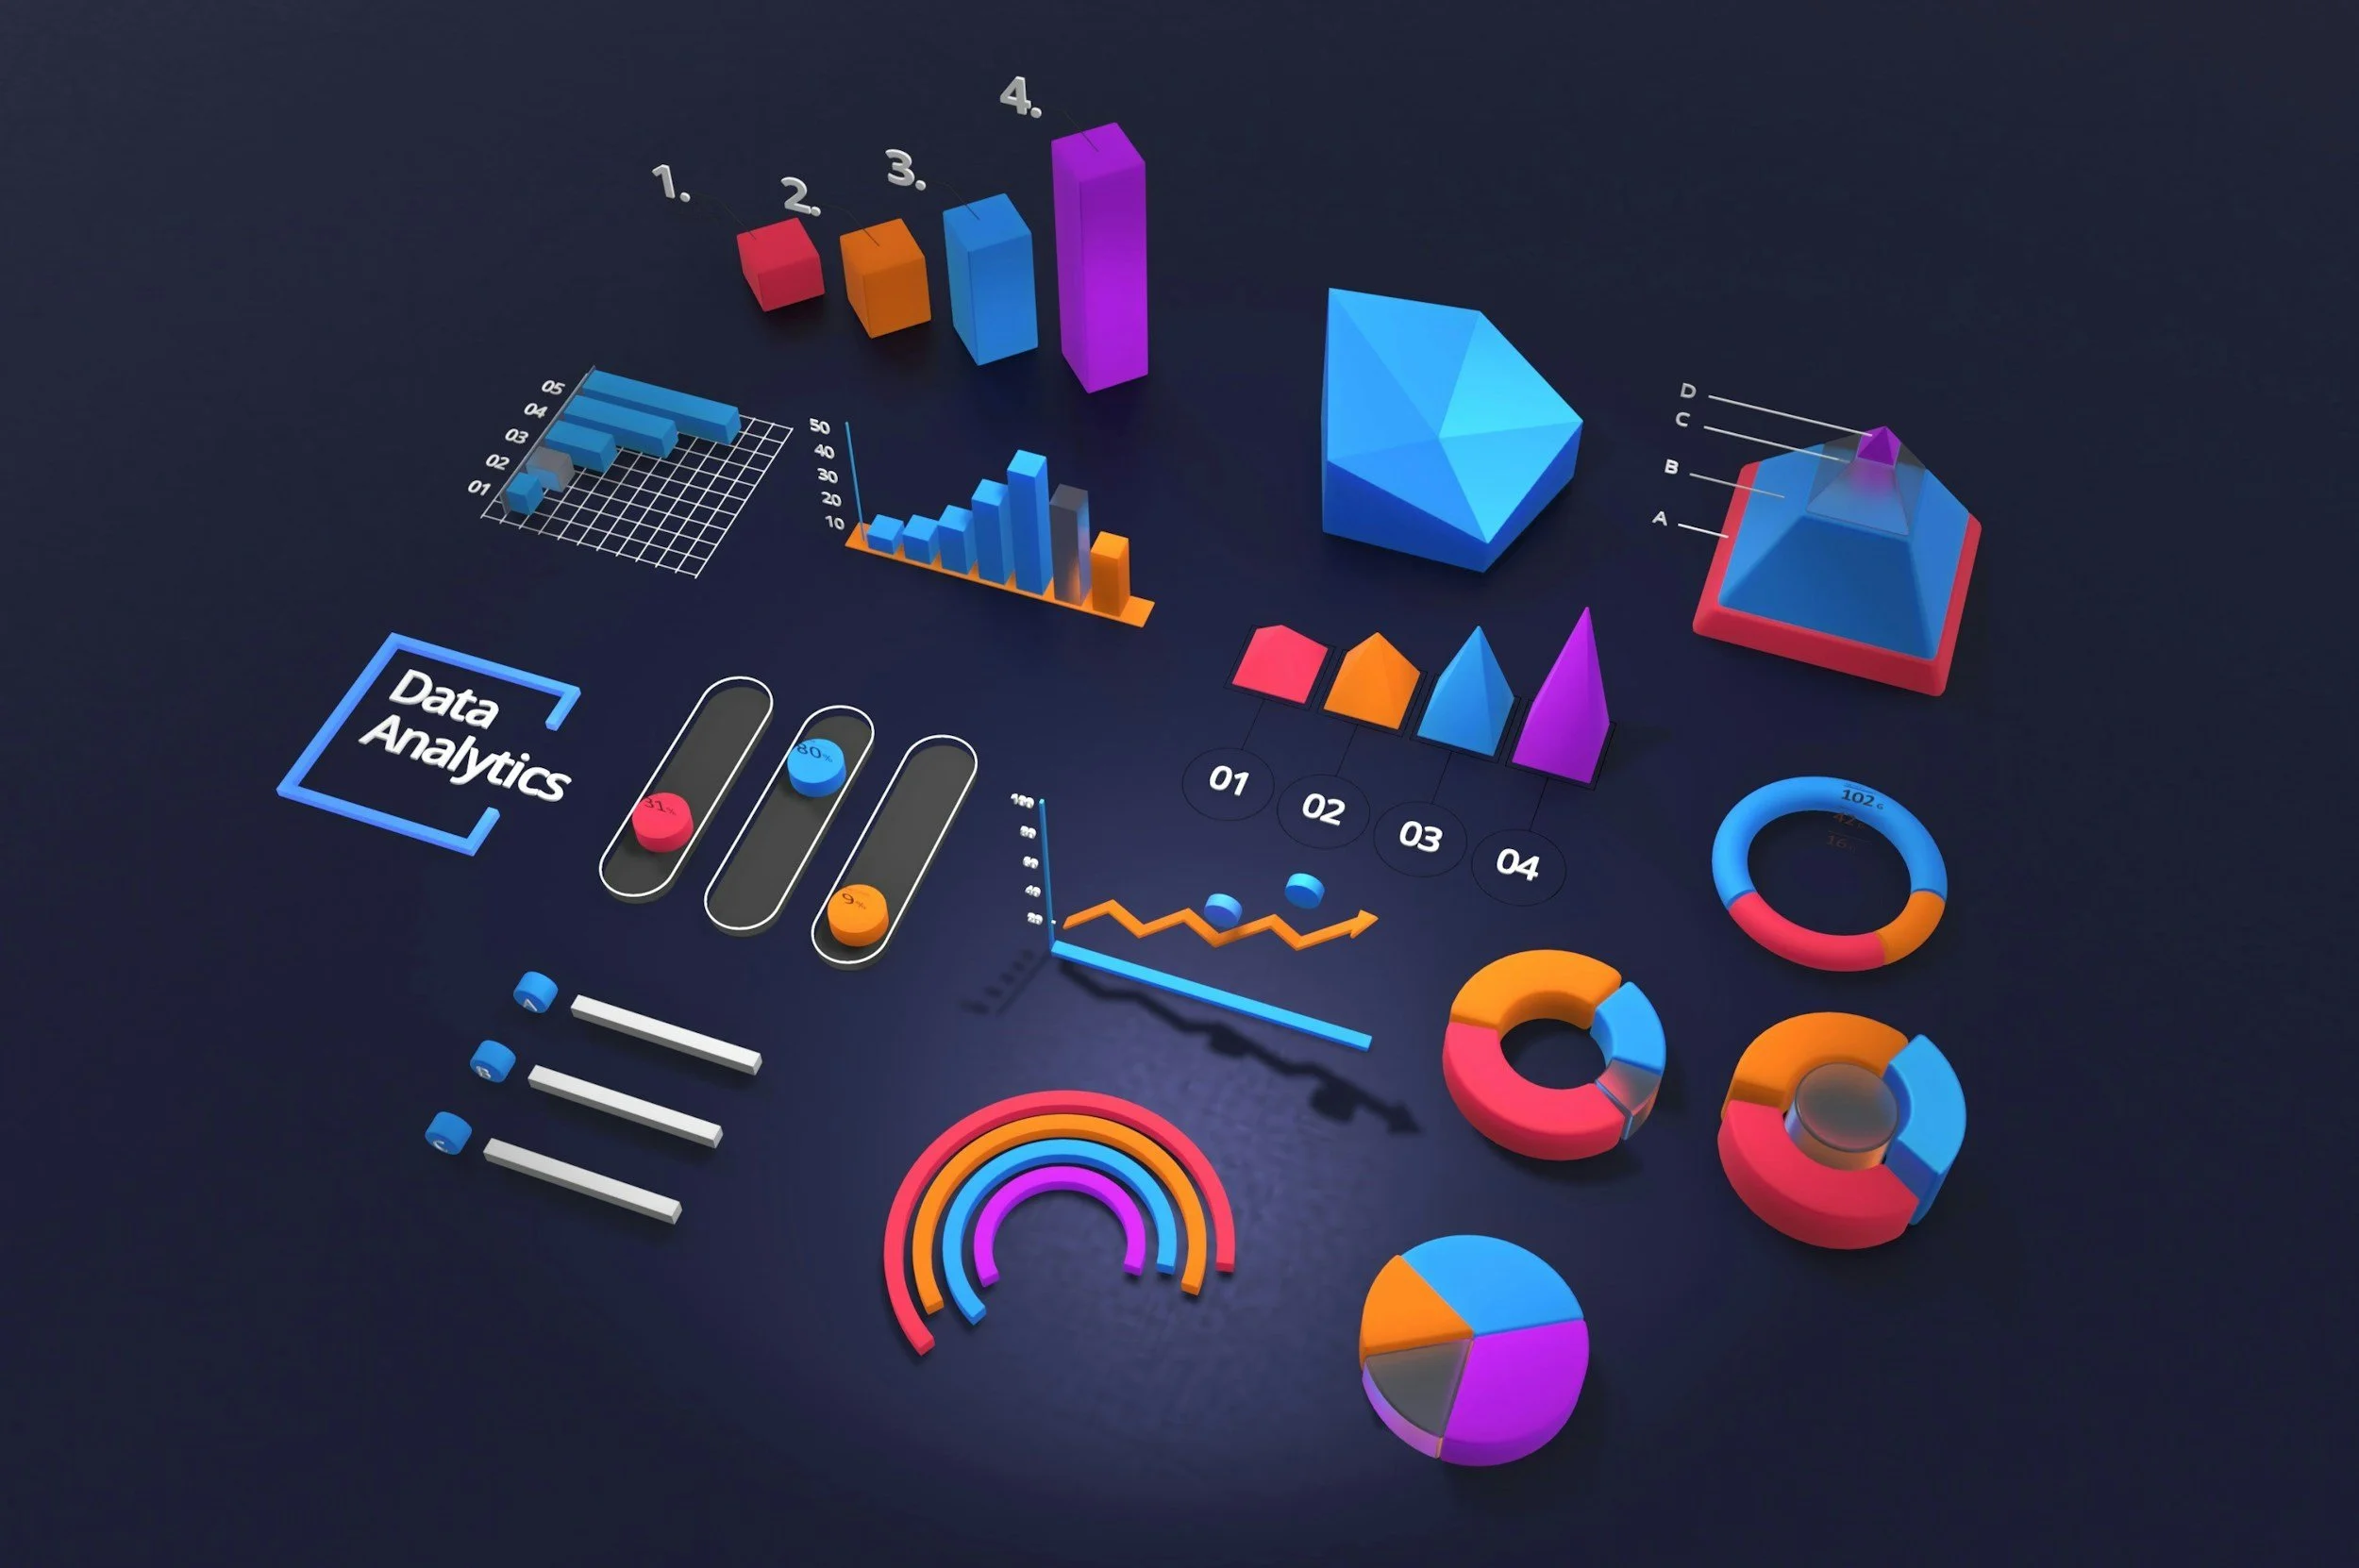
Colorful 3D data visualization charts and graphs, including bar graphs, pie charts, line graphs, and circular gauges on a dark background, representing data analysis and metrics.

Improving Systems and reducing Automation and Administration

Build and test automated workflows, reducing time, labor, and frustrations
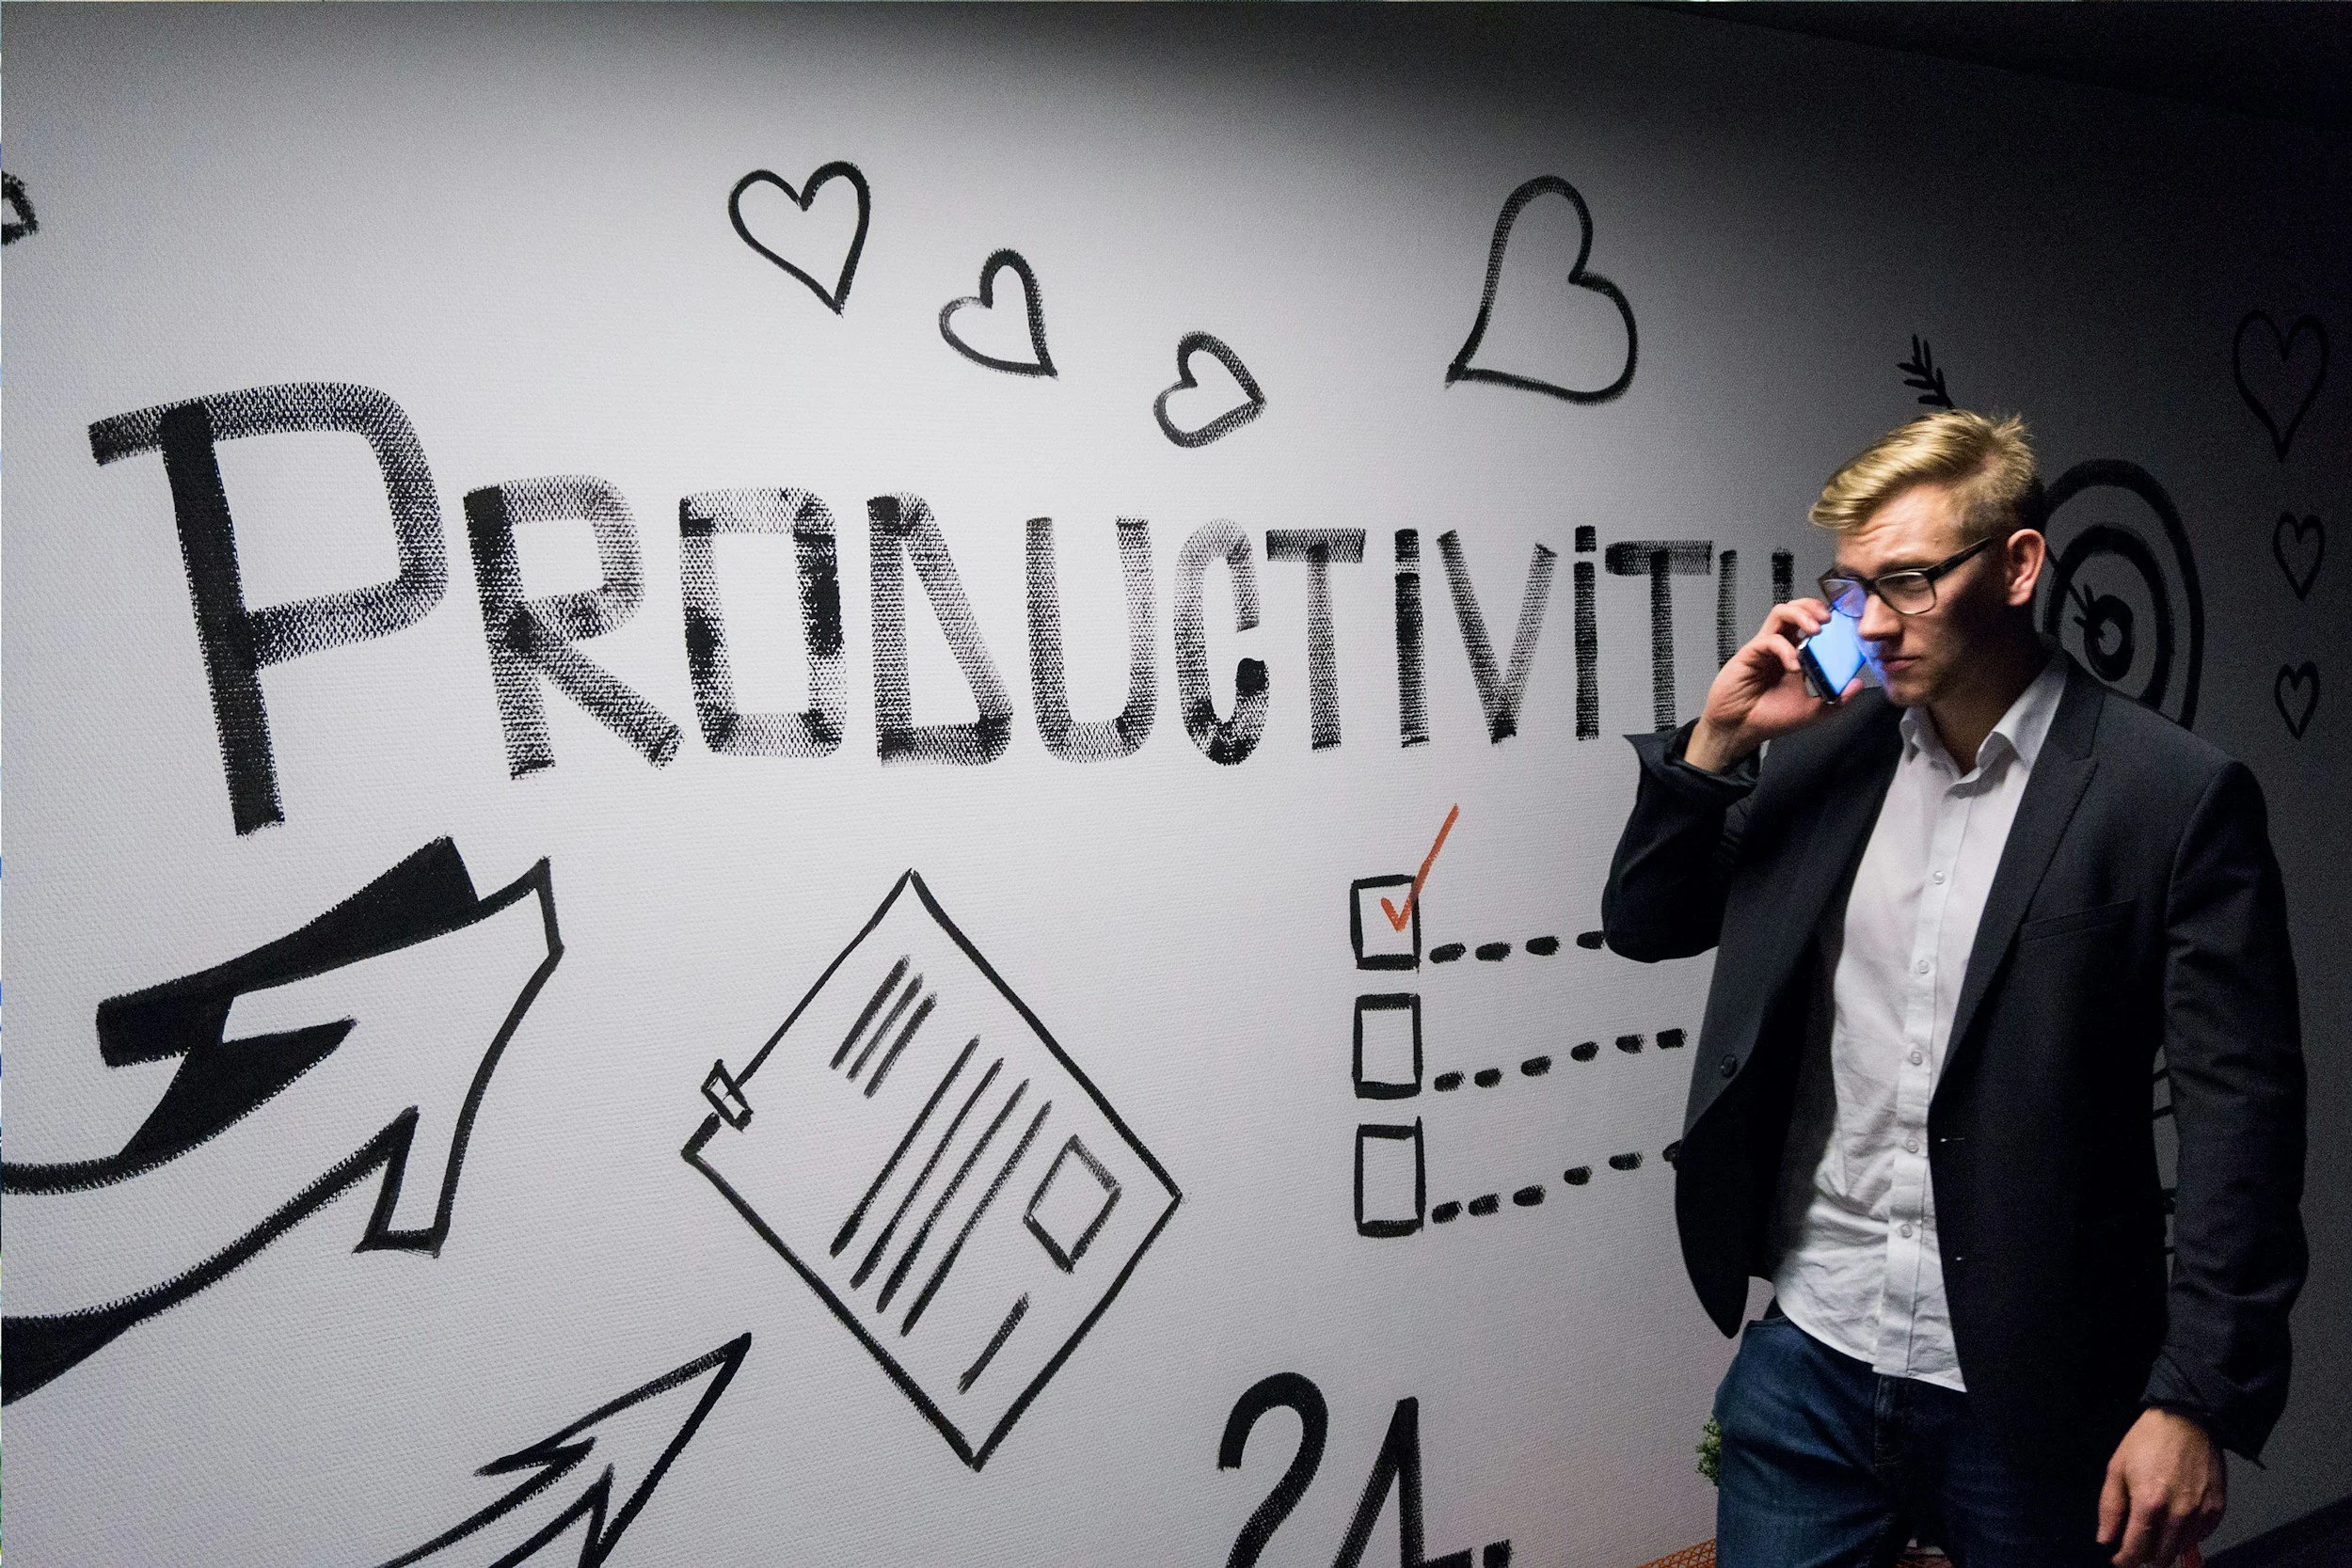
A man in a suit and glasses talking on a cellphone while standing in front of a white wall with black drawings and the word 'PRIVACY' written on it.

50% reductions in costs = 20% increase in Margins

Implement the changes to see the full value of Technology drop to your bottom line.